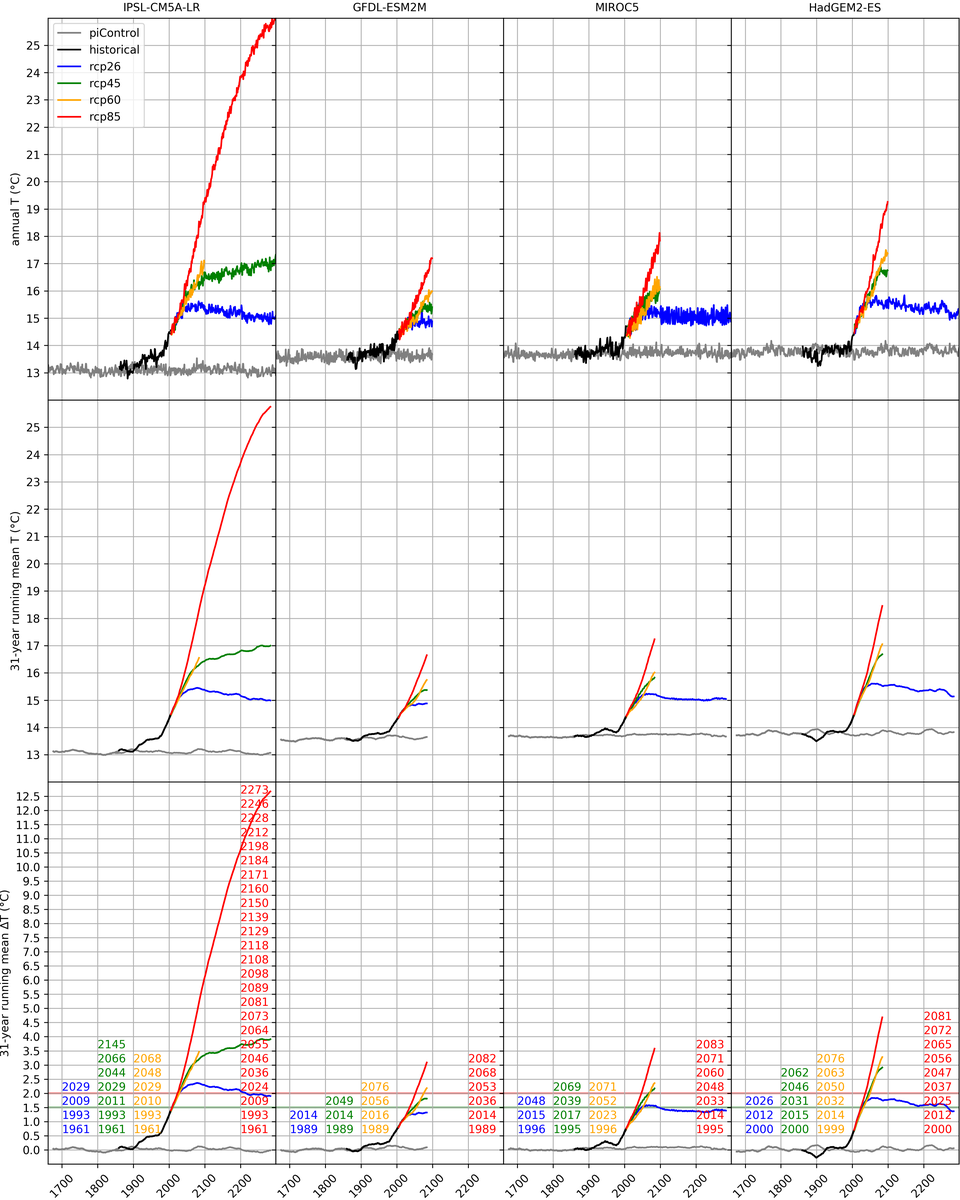
Here are some thoughts on how ISIMIP2b simulations can be analysed to address different scientific questions involving global-mean temperature thresholds. You are invited to comment and add to these notes, which are intended to assist the entire ISIMIP community, whilst not being prescriptive. The precise nature of the scientific question will determine the appropriate method for handling thresholds.
- Homepage
- Simulation Protocols
- ISIMIP2b temperature thresholds and time slices
ISIMIP2b temperature thresholds and time slices
The plots show: (upper row) annual global mean tas; (middle row) 31-year running mean of global mean tas; (lower row) 31-year running mean of global mean tas minus 1661-1860 global mean piControl tas. Each column depicts a different global climate model and the colours represent the pre-industrial (grey), historical (black), RCP2.6 (blue), RCP4.5 (green), RCP6.0 (yellow), and RCP8.5 (red) scenarios. All of these plots are based on bias-corrected tas values.

Below are tables of the year in which the (bias-corrected) 31-year running mean of global mean temperature crosses the given thresholds.
RCP2.6
| GMT-threshold | IPSL-CM5A-LR | GFDL-ESM2M | MIROC5 | HadGEM2-ES |
|---|---|---|---|---|
| 3.0° | - | - | - | - |
| 2.5° | - | - | - | - |
| 2.0° | 2029 | - | - | - |
| 1.5° | 2009 | - | 2048 | 2026 |
| 1.0° | 1993 | 2014 | 2015 | 2012 |
| 0.5° | 1961 | 1989 | 1996 | 2000 |
RCP4.5
| GMT-threshold | IPSL-CM5A-LR | GFDL-ESM2M | MIROC5 | HadGEM2-ES |
|---|---|---|---|---|
| 3.0° | 2066 | - | - | - |
| 2.5° | 2044 | - | - | 2062 |
| 2.0° | 2029 | - | 2069 | 2046 |
| 1.5° | 2011 | 2049 | 2039 | 2031 |
| 1.0° | 1993 | 2014 | 2017 | 2015 |
| 0.5° | 1961 | 1989 | 1995 | 2000 |
RCP6.0
| GMT-threshold | IPSL-CM5A-LR | GFDL-ESM2M | MIROC5 | HadGEM2-ES |
|---|---|---|---|---|
| 3.0° | 2068 | - | - | 2076 |
| 2.5° | 2048 | - | - | 2063 |
| 2.0° | 2029 | 2076 | 2071 | 2050 |
| 1.5° | 2010 | 2056 | 2052 | 2032 |
| 1.0° | 1993 | 2016 | 2023 | 2014 |
| 0.5° | 1961 | 1989 | 1996 | 1999 |
RCP8.5
| GMT-threshold | IPSL-CM5A-LR | GFDL-ESM2M | MIROC5 | HadGEM2-ES |
|---|---|---|---|---|
| 3.0° | 2046 | 2082 | 2071 | 2056 |
| 2.5° | 2036 | 2068 | 2060 | 2047 |
| 2.0° | 2024 | 2053 | 2048 | 2037 |
| 1.5° | 2009 | 2036 | 2033 | 2025 |
| 1.0° | 1993 | 2014 | 2014 | 2012 |
| 0.5° | 1961 | 1989 | 1995 | 2000 |
